文章說, 金價有可能繼續弱勢, 要到10月/11月才會展升浪 !
www.silverdoctors.comSubmitted by Craig Hemke, TFMetals:
We’ve
been watching for two weeks as prices have once again been pushed
backward into expirations. However, the pattern calls for a renewed up
trend to begin as soon as next week. Is it possible to connect the dots
and project that far out? Yes!
As we’ve been
following for the past two weeks, the USDJPY has now rallied seven
points or 7% in just eight days as Krazy Kuroda in Japan has promised to
buy 1T yen worth of new government debt and perhaps even begin the
“helicopter money” plan of direct government debt monetization going
forward.
The
correlation between the yen and gold has been present for years and we
have monitored it closely since 2014. As a reminder, here’s how it looks
in 2016:

This unexpected
rally in the USDJPY (the inverse of the yen shown above) has
conveniently helped the market-making Bullion Banks to manage their
positions into the front-and-delivery month August gold expirations next
week. Here’s the calendar:
Tuesday, July 26 – August gold option expiration
Thursday, July 28 – August gold contract “expiration” as it goes “off the board”
Friday, July 29 – August gold First Notice Day as August gold trades only with 100% margin and in its “delivery” phase
Previously
in 2016, there’s a clear pattern of price management and selloffs as
front-and-delivery month contracts moved toward expiration. As you can
see below, the latter stages of March (ahead of April) and May (ahead of
June) saw declines similar to what are seeing now:

But more importantly, look at the
gold price action while “deliveries” were taking place this year. During
the calendar months of February, April and June, gold has soared
anywhere from 7% to 12%! Could August be setting up for a similar move? Yes!

And what, besides
the end of the August expirations next week could prompt such a
turnaround? Most likely, another change in sentiment and trend in the
USDJPY. And what might cause that shift? Two events that will occur
within 36 hours of each other next Wednesday and Friday:
Wednesday, July 27 – FOMC meeting ends with “Fedlines” announced at 2:00 pm EDT. No rate changes!
Friday, July 29 –
The Bank of Japan meets and releases its latest QE plans.
However, with
the USDJPY already having moved over 7% ahead of this “news”, this sets
up as a classic “buy-the-rumor, sell-the-news” event. The thought here
is that the USDJPY then will resume its downtrend in early August. See
link here: http://www.reuters.com/article/us-boj-markets-idUSKCN10032J
And the USDJPY has
already reached a major point of resistance on its chart.
This, too,
hints at a turnaround soon and continuation of the downtrend:

So, if we’re
looking at a reversal and continuation of gold’s 2016 uptrend in August,
how far might the next leg up take price. For an answer, we’re going to
consult another chart.
Back in February,
we started following an important breakout on gold’s weekly chart. The
chart below is from Friday, March 7 and shows goldfinally breaking out from its nearly 3-year downtrend:

What happened next? Well, as noted above,
March was an “expiration” month for the April Comex contract AND, even
more importantly, a breakout of this 3-year trend was something that The
Banks wanted to avoid. By the end of the month, the chart looked like
this:

Eventually, though, the falling USDJPY and
the surging amount of global debt with negative interest rates served
to drive gold even higher. By the middle of June, it became clear that
The Banks were going to lose this fight. The Brexit vote that followed
only served to seal their fate:

The last remaining line of defense for The
Banks and their maintenance of a downtrend in gold was violated with
the weekly close back on Friday, July 8. (Again, what an interesting
coincidence that Kuroda’s unexpected announcements came before trading
resumed the following Monday, July 11.)
Here’s a chart we posted with
that day’s podcast review:
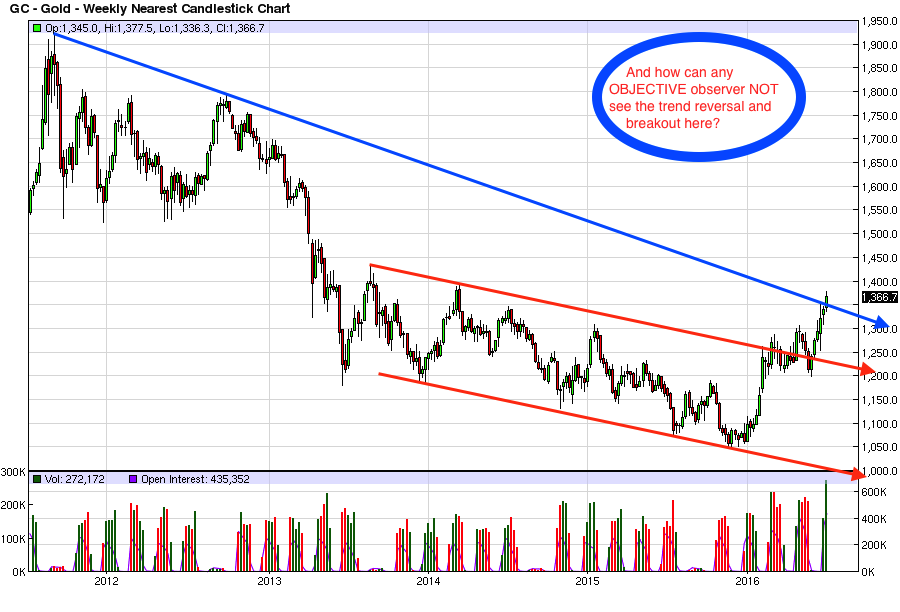
As you can see, it should have been clear
to any objective observer that gold had bottomed and a renewed bull
market had begun. That The Banks have used the USDJPY strength and the
Spec liquidation surrounding August contract expirations to their
advantage should, therefore, come as no surprise. They are attempting
the same block-and-stall routine that they put on gold back in March
when it broke out of its 3-year down channel. Therefore, expect the same
fight now. Though we should expect price improvement and a renewed
rally in August, do not be surprised if it takes until October for gold
to really get cooking to new highs. Again, the March to May action
around the earlier breakout is your guide.

So, summing up, what should we expect going forward:
Further choppy to downward price action into late next week. It’s still possible that gold could trade as low as $1285 and back near its 50-day moving average before bottoming. This area has proven as support all year.

- A renewed rally in August back to near, but likely not exceeding much, the highs of late June and early July. Something between $1370 and $1390. Talk will begin to spread that gold has seen a “double top”.
- Another tumble in mid-late September as the next front and delivery month (October) comes off the board, However, October is never a big volume or big “delivery” month. Instead, most of the action after August typically shifts into the December contract. Therefore, following the 2016 pattern, any dropoff in September should be more shallow than what we’re seeing at present.
- Then, finally, a breakout to new 2016 highs in October and November. This year-end rally should take gold all the way back to near the April 2013 manipulated breakdown level of $1525. Let’s call it $1475-$1525.

So there
you go. That’s what we expect. If I’m proven correct, I’ll gladly take
all the adulation that comes this way. If we’re wrong…well, I’m not
eating my hat again. That almost killed me last time.
Have a great day,
TF
沒有留言:
張貼留言